Visual Chart v.4.0.9.9
Advertisement
Description
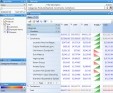
Visual Chart is a very effective program which is used for tracking and following the current financial scenarios. The program has the capability to keep its user updated with any significant events happening at a stock exchange. The Visual Chart application also serves as a wonderful and effective tool for compilation and interpretation of market data and handling the information effectively, to make the task of decision-making easy for its...
Read more
- Rate:
- Release Date:10/07/2011
- License:Freeware
- Category:Business
- Developer:Visual Chart Group
- Downloads:29
- Size:54.92 Mb
- Price: Free
To free download a trial version of Visual Chart, click here
To visit developer homepage of Visual Chart, click here
Advertisement
System Requirements
Visual Chart requires Windows.
Visual Chart v.4.0.9.9 Copyright
Shareware Junction periodically updates pricing and software information of Visual Chart v.4.0.9.9 full version from the publisher using pad file and submit from users. Software piracy is theft, Using crack, password, serial numbers, registration codes, key generators, cd key, hacks is illegal and prevent future development of Visual Chart v.4.0.9.9 Edition. Download links are directly from our publisher sites. Links Visual Chart v.4.0.9.9 from Bittorrent, mediafire.com, uploadfiles.com, hotfiles.com rapidshare.com, megaupload.com, netload.in, storage.to, depositfiles.com and other files hosting are not allowed. The download file is obtained directly from the publisher, not from any Peer to Peer file sharing applications such as Shareaza, Limewire, Kazaa, Imesh, eDonkey, eMule, Ares, BearShare, Overnet, Morpheus, BitTorrent Azureus and WinMX.
Review This Software
More Visual Chart Software
Advertisement
FCEditor .NET v.2.1.0.313
FCEditor .NET is an instrument for building flow charts of programs from the code on Pascal, Delphi and C#. The chart can be edited, saved and exported into a graphic file. The basic FCEditor feature that makes it different from other programs of
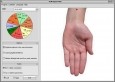
Chrono Acupuncture -TCM open points v.2.0
This software provides you with 3 methods of Open Points calculating in classical chinese acupuncture. You should choose necessary time, date and one of 3 Open Point methods. The software displays the "open points" for an influence of any kind:
Code Visual to Flow chart v.3 3
Code Visual to Flowchart is a program Flow chart generator for code flowcharting and visualization.It can perform automated reverse engineering of program code into programming flowcharts . ,help programmers to document,visualize and understand

Java Chart Designer
Create professionally looking presentations and reports with Java Chart Designer. Feature rich and powerful application gives you full power to create outstanding report and presentation projects. A user-friendly interface, great number of visual effects
RadarCube OLAP Chart Windows Forms v.2.50.0
NET Windows Forms OLAP controls (both Grid and Chart) to add Visual OLAP Analysis to your applications. Displays business data in charts and graphs rather than in numbers. Works with a relational database or MS Analysis Services.
RadarCube ASP.NET OLAP Chart for MSAS v.2.70.0
ASP.NET and Silverlight OLAP control to add Visual Analysis to your applications. Displays business data on the internet in charts and graphs rather than in numbers. Works with MS Analysis Services OLAP Server. 100% managed code authored in C# 2.0
RadarCube WPF OLAP Grid and Chart v.1.30.0
A set of WPF controls (OLAP Grid and OLAP Chart) to add OLAP and Visual Analysis functionality to your WPF applications. OLAP Grid displays data in an interactive pivot table and OLAP Chart shows the same data in charts and graphs.
PSI-Chart v.1.0
PSI-Chart is an Active X chart component for creating and designing scientific and engineering chart applications with Visual Basic, Visual C++, C#, or other language compilers which support the COM model.
Nevron Chart for SSRS 2009_Vol.1 v.1.0
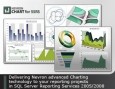
Nevron Chart for SQL Server Reporting Services (SSRS) is an advanced report item, which delivers a complete set of 2D and 3D charting types, highly customizable axes, tight data integration and unmatched visual effects to your reports.
Nevron Chart for SSRS v.2016.1
Nevron Chart for SSRS (market's leader for its visual style, effects,layout features and data integration) is a solution,designed to provide an easy and powerful way to implement state-of-art charts in any report, modified with MS Reporting Services.

Dragonfly Chart .Net
.Net Window Form Chart Components including DAS_Net_PieChart, DAS_Net_FlatPieChart, DAS_Net_3DPieChart, DAS_Net_BarChart, DAS_Net_FlatBarChart, DAS_Net_XYChart and DAS_Net_AngularChart and others provide powerful chart functionalities which can meet